Council margin – LNP 16.6%
Mayoral margin – LNP 17.6%
Incumbent councillor
Fiona King, since 2008.
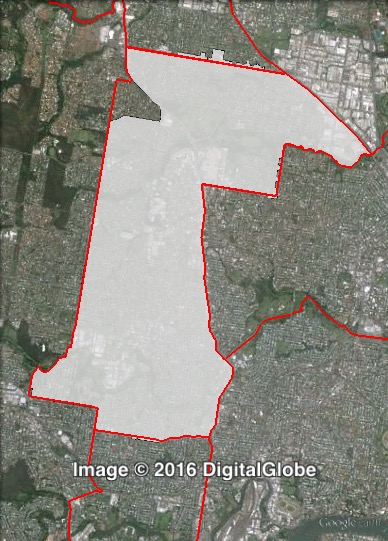
Geography
Northern Brisbane, Marchant covers the mid-northern suburbs of Chermside, Stafford and Gordon Park.
Redistribution
Marchant underwent minor changes, with part of Aspley transferred to McDowall. These changes cut the LNP council margin from 16.9% to 16.6%, and the mayoral margin from 17.9% to 17.6%.
History
Labor’s Terry Hampson won Marchant in 1994. He was re-elected in 1997 and 2000.
In 2004, Hampson was succeeded by Labor candidate Faith Hopkins, who held the seat with a 3.8% margin, which was cut to 3% in the 2008 redistribution.
At the 2008 election, Liberal candidate Fiona King defeated Hopkins with an 11% swing. King was re-elected in 2012 with a further 8.9% swing.
Candidates
- Richard Nielsen (Greens)
- Fiona King (Liberal National)
- Stephanie Serhan (Labor)
Assessment
Marchant is the kind of ward which had been held by Labor before losing control of council in 2008. The LNP has gained a cumulative swing of about 20% over the last two elections. This suggests that there is capacity for the LNP to lose a lot of support, but a 16.6% margin is still very sizeable, and may not be possible to overcome in one campaign.
2012 council result
| Candidate | Party | Votes | % | Swing | Redist |
| Fiona King | Liberal National | 13,588 | 61.8 | +7.7 | 61.4 |
| Blair Thompson | Labor | 6,144 | 27.9 | -9.5 | 28.2 |
| Neil Martin | Greens | 2,262 | 10.3 | +1.8 | 10.4 |
| Informal | 452 | 2.0 |
2012 council two-party-preferred result
| Candidate | Party | Votes | % | Swing | Redist |
| Fiona King | Liberal National | 13,846 | 66.9 | +8.9 | 66.6 |
| Blair Thompson | Labor | 6,853 | 33.1 | -8.9 | 33.4 |
| Exhausted | 1,256 |
2012 mayoral result
| Candidate | Party | Votes | % | Swing | Redist |
| Graham Quirk | Liberal National | 13,554 | 61.6 | +0.7 | 61.2 |
| Ray Smith | Labor | 5,754 | 26.2 | -3.5 | 26.4 |
| Andrew Bartlett | Greens | 2,207 | 10.0 | +3.4 | 10.1 |
| Rory Killen | Independent | 282 | 1.3 | +1.3 | 1.3 |
| Chris Carson | Independent | 195 | 0.9 | +0.9 | 0.9 |
| Informal | 459 | 2.0 |
2012 mayoral two-party-preferred result
| Candidate | Party | Votes | % | Swing | Redist |
| Graham Quirk | Liberal National | 13,858 | 67.9 | +1.7 | 67.6 |
| Ray Smith | Labor | 6,543 | 32.1 | -1.7 | 32.4 |
| Exhausted | 1,591 |
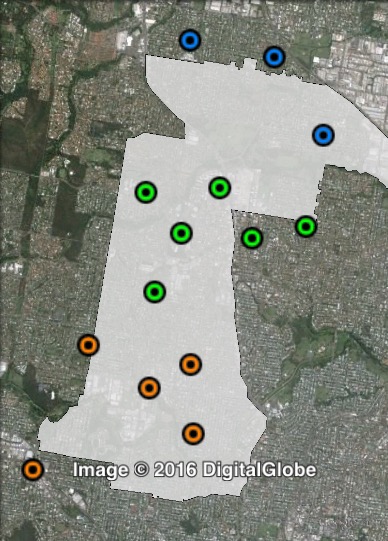
Booth breakdown
Booths in Coorparoo have been split into three parts: central, north and south.
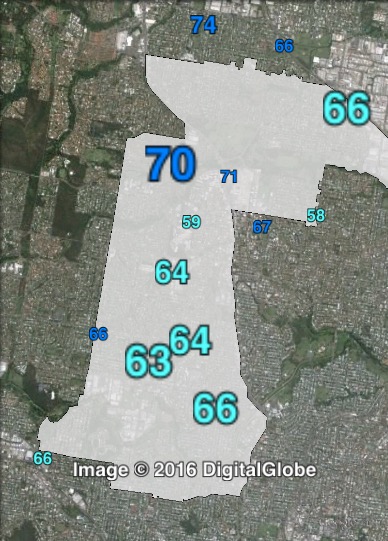
The LNP’s two-party-preferred vote ranged from 68.6% in the north to 64.7% in the south.
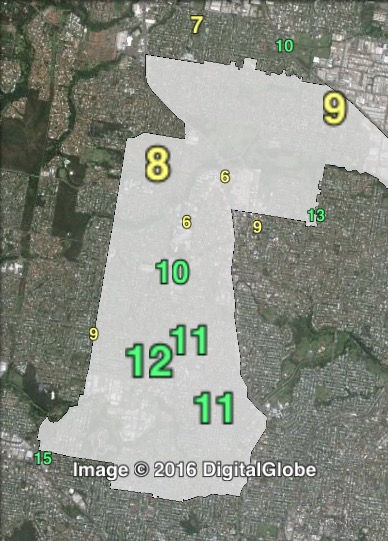
The Greens polled between 8% and 9% in the centre and north, and 11.3% in the south.
| Voter group | GRN council primary | LNP council 2PP | Total votes | % of votes |
| South | 11.3 | 64.7 | 6,186 | 29.4 |
| Central | 8.8 | 66.6 | 4,930 | 23.4 |
| North | 8.5 | 68.6 | 3,208 | 15.3 |
| Other votes | 11.6 | 67.4 | 6,701 | 31.9 |