The government indicated that this election would be suspended, but this is yet to happen, with nominations being declared and postal vote kits sent out, so this has been updated.
The City of Liverpool covers parts of south-western Sydney, including Liverpool, Chipping Norton, Warwick Farm, Moorebank, Holsworthy, Casula, Prestons, Lurnea, Green Valley, Hoxton Park, Austral and Badgerys Creek.
Liverpool has a population of approximately 240,000 people as of 2019.
- Wards
- Incumbent mayor and councillors
- History
- Council control
- Candidate summary
- Assessment
- 2021 results
- Vote breakdown by ward
- Results maps
Wards
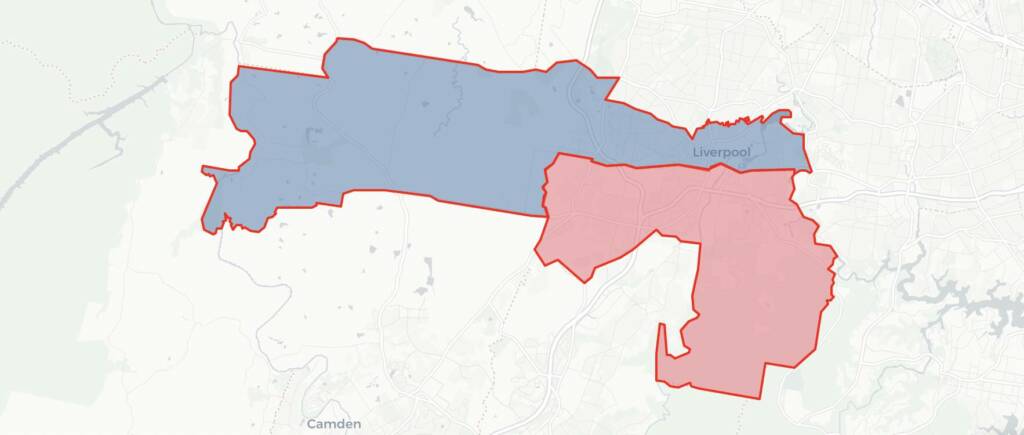
Liverpool is divided up into two wards, with each ward electing five councillors. The council also includes a directly-elected mayor.
North ward covers parts of Liverpool council north of Newbridge Road and Hoxton Park Road, including Chipping Norton, Warwick Farm, Ashcroft, Cartwright, Miller, Busby, Hinchinbrook, Green Valley, Cecil Hills and parts of Liverpool, as well as the rural western edge of the council, including Badgerys Creek, Austral, Rossmore and Bringelly.
South ward covers the remainder of the council, including those suburbs at the eastern edge. The suburbs include Holsworth, Wattle Grove, Moorebank, Casula, Lurnea, Prestons, Hoxton Park, Horningsea Park and West Hoxton.
Incumbent mayor
Ned Mannoun (Liberal)
Incumbent councillors
| North Ward | South Ward |
| Mel Goodman (Liberal) | Richard Ammoun (Liberal) |
| Mazhar Hadid (Liberal) | Betty Green (Labor) |
| Nathan Hagarty (Labor) | Charishma Kaliyanda (Labor) |
| Peter Harle (Independent) | Fiona Macnaught (Liberal) |
| Ali Karnib (Labor) | Karress Rhodes (Independent) |
History
Liverpool has been historically dominated by Labor. Labor dominated the council up until 2004, but the Liberal Party have done well on the council since the restoration of democratic control in 2008.
The first directly-elected mayor of Liverpool was Mark Latham, who won the mayoralty in 1991. He resigned as mayor in 1994 after winning the Werriwa federal by-election.
Latham was succeeded by George Paciullo. Paciullo had a previous career on Liverpool council from 1959 until 1971, including one year as mayor in the late 1960s. He had then served as a state MP from 1971 until 1988, and as a minister in the Wran and Unsworth governments. He returned to the local council after leaving state politics.
Paciullo was elected mayor in 1995 and 1999. Liverpool City Council was sacked by the state government two weeks before the 2004 council election, in part due to issues around the controversial Oasis development. This ended Paciullo’s ten years as mayor.
The council was kept in administration for four years, and in 2008 a new council was elected. This council was led by Labor mayor Wendy Waller. The ten members of the council included four Labor members (not including the mayor), three Liberals, two members of the Liverpool Community Independents Team, along with conservative independent Gary Lucas.
While Labor held the mayoralty, they did not have a working majority on the council, and more often than not the three independents sided with the three Liberals to outvote for the five Labor councillors.
Labor had a poor election in Liverpool in 2012, as they did across Western Sydney. Labor’s vote dropped by 5.9%. The vote for the Liverpool Community Independents Team also dropped by 9.3%, and 7% less chose to vote for independents. Most of this vote flowed to the Liberal Party, who gained a 16.25% swing.
The Liberal Party’s Ned Mannoun won the mayoralty comfortably ahead of the incumbent Waller in 2012. The Liberal Party won five other council seats out of ten, with Labor winning four and the LCIT winning one seat. This gave the Liberal Party an overall majority on the council.
Labor won back the mayoralty in 2016 but fell one seat short of a majority. They only retained their four council seats, needing five plus the mayor for a majority. The mayoralty was only won by a margin of 3.6%.
The Liverpool Community Independents Team also won back a second council seat off the Liberal Party.
The ALP has held the mayoralty but has not had control over the council, with the LCIT more often than not siding with the Liberal Party for a 6-5 majority over Labor.
The 2021 election saw the return of Ned Mannoun as mayor, but there were no other changes to the council. This gave the Liberal Party five seats to four Labor and two LCIT. The Liberal Party solidified a 6-5 majority in alliance with independent Karress Rhodes.
Council control
There have been three deputy mayoral elections during the current term. At each of those three elections, the two LCIT independents split: Harle siding with Labor and Rhodes with the Liberals. Indeed the first deputy mayoral election in February 2022 was contested by both independents. It appears that the two independents have suffered a deeper division over Rhodes’ support for the Liberals. That support has solidified a one-seat majority for the Liberal Party.
Candidate summary
Sitting Labor councillors Charishma Kaliyanda, Nathan Hagarty and Ali Karnib are not running for re-election. Sitting Liberal councillor Mazhar Hadid is not running for re-election, and sitting Liberal councillor Mel Goodman is running for the unwinnable fifth spot on his party’s ticket. Richard Ammoun is switching from the South Ward to the North Ward.
The Liberal Party and Labor Party are both running a full ticket, with incumbent councillors Ned Mannoun and Betty Green running for mayor.
The Liverpool Community Independents Team, Libertarian Party and Our Local Community are all running full tickets across the mayoralty and the two wards.
Sitting independent councillor Karress Rhodes and Community Voice are both running for mayor and in the South Ward. Tony Estephen is leading an independent ticket in the North Ward.
Assessment
The Liberal Party’s current working majority appears to be built on the back of their victory in the mayoral election, suggesting that a Labor win in that contest (which was quite close in 2021) would likely shift the balance of power.
It’s also not clear what will happen with the two independents, who ran together in 2016 and 2021. They won’t be running together in 2024.
At the moment Liverpool has settled into an equilibrium where each ward elects two Labor, two Liberal and one LCIT, and the council balance is decided by the mayoral election. But if the independents falter, it might create space for one of the major parties to win third seats in each ward.
| Party | Votes | % | Swing | Seats won |
| Liberal | 42,115 | 38.42 | +3.1 | 4 |
| Labor | 41,732 | 38.07 | -2.6 | 4 |
| Community Independent Team | 10,803 | 9.85 | -4.5 | 2 |
| Other independents | 7,595 | 6.93 | +3.1 | |
| Greens | 7,379 | 6.73 | +1.1 | |
| Informal | 10,830 | 8.99 |
2021 mayoral election result
| Candidate | Party | Votes | % | Swing |
| Ned Mannoun | Liberal | 48,112 | 41.77 | +9.1 |
| Nathan Hagarty | Labor | 43,870 | 38.09 | 0.0 |
| Michael Andjelkovic | Independent | 9,770 | 8.48 | +8.5 |
| Peter Harle | Independent | 8,254 | 7.17 | -2.7 |
| Asm Morshed | Greens | 5,171 | 4.49 | +0.4 |
| Informal | 5,479 | 4.54 |
2021 mayoral election two-candidate-preferred result
| Candidate | Party | Votes | % | Swing |
| Ned Mannoun | Liberal | 51,277 | 51.27 | +4.9 |
| Nathan Hagarty | Labor | 48,741 | 48.73 | -4.9 |
| Exhausted | 15,159 |
Vote breakdown by ward
The following tables show the vote in each ward. Unfortunately the mayoral results were not separated by ward, so we can only identify the home ward of ordinary votes.
The Liberal Party generally performed more strongly in the North Ward, while Labor did better in the South Ward, at least for the council election. For the mayoral election, the Liberal lead was larger in the South Ward booths.
Council results by ward
| Ward | ALP % | LIB % | LCIT % | GRN % |
| North Ward | 34.8 | 39.0 | 11.1 | 8.8 |
| South Ward | 41.6 | 37.2 | 8.7 | 4.9 |
Mayoral results by ward
| Ward | LIB % | ALP % | % of total |
| North Ward | 41.2 | 38.4 | 27.9 |
| South Ward | 46.1 | 35.0 | 18.5 |
| Other votes | 40.6 | 39.0 | 53.6 |
Election results at the 2021 City of Liverpool election
Toggle between primary votes for the Liberal Party, Labor, the Liverpool Community Independent Team and the Greens.
Election results at the 2021 City of Liverpool mayoral election
Toggle between primary votes for the Liberal Party, Labor, and independent candidates Michael Andjelkovic and Peter Harle.
Candidates – Mayor
- Gemma Noiosi (Libertarian)
- Michael Tierney (Independent)
- Michael Andjelkovic (Independent)
- Cr Ned Mannoun (Liberal)
- Peter Ristevski (Our Local Community)
- Cr Betty Green (Labor)
- Deb Gurung (Community Voice)
- Cr Karress Rhodes (Independent)
- Cr Peter Harle (Liverpool Community Independents Team)
- Robert Aiken (Unaffiliated)
Candidates – North Ward
- A – Liberal
- Cr Richard Ammoun
- Matthew Harte
- Milica Alavanja
- Jane Colley
- Wael Manoun
- B – Labor
- C – Liverpool Community Independents Team
- Cr Peter Harle
- Daniel Francis Kneipp
- Mikaela Conners
- Rayman Solagna
- Marc Conners
- D – Libertarian
- Gemma Noiosi
- Caleb Cochrane
- Adam Osman
- Donald Brooke
- Jennilee Cochrane
- E – Our Local Community
- Florina Nero
- Jay Matthews
- Dejana Miric
- Bruce Missen
- Charlie Ristevski
- F – Independent
- Tony Estephen
- Lela Panich
- Christopher Sparrow
- Eric North
- Diane Wills
Candidates – South Ward
- A – Libertarian
- Victor Tey
- Peter Runge
- Anthony Noiosi
- Carmel Corigliano
- John Breakspear
- B – Our Local Community
- Peter Ristevski
- Dhurgham Al-Sulaimawi
- Shalini Nadan
- Sonia Hussein
- Mary Ristevski
- C – Community Voice
- Deb Gurung
- Fia Pesa
- Afzal Chowdhury
- Bhabana Parajuli Bastakoti
- Bijay Shrestha
- D – Labor
- Cr Betty Green
- Ethan Monaghan
- Mohan Dev Bhatt
- Alaa Ahmad
- Rajesh Kumar
- E – Independent
- Michael Tierney
- Alice Tierney
- Emily-Claire Khemananta
- F – Liberal
- Cr Ned Mannoun
- Cr Fiona Macnaught
- Emmanuel Adjei
- Sid Shaheed
- Cr Melhem Goodman
- G – Liverpool Community Independents Team
- Criss Moore
- Susie Kneipp
- June Young
- Michael Russell
- Kevin James Moore
- H – Independent
- Cr Karress Rhodes
- Tarkan Fahri
- Carla Filipakis
- Robert Kadir
- Jody Reeks
- Ungrouped
- Michael Andjelkovic (Independent)
- Margarida Boa Morte (Independent)
See my comment on Fairfield for my thoughts on Liverpool. The DLFCN and to a lesser extent the Liberals will likely pick up seats here.
In Response to the comments in Canterbury-Bankstown thread about the Israel-Palestine conflict. It is important to remember this council has the second highest % of Muslims after the previously mentioned council and it is concentrated in the working class suburbs along the rail line (Warwick Farm, Liverpool, Lurnea and Casula). Ned Mannoun has helped the Liberals make inroads into the Muslim coummunity it is unthinkable that Libs outpoll Labor in those suburbs i mentioned.
@ Nether Portal, if you could do a map like the great ones you have done maybe by Sydney council on Religion etc
Why is this postponed? Until when is it postponed?
It appears the NSW government temporarily suspended this council due to an investigation into potential misuse of funds. Like Central Coast council, an administrator will likely be appointed but Liverpool successfully won a court challenge to delay the start of investigation proceedings.
@Nimalan sure I can do that.
Thanks Nether Portal, It should be the same as the map for Religion and the Census Data should have it by LGA level 🙂
Also interesting if Eastern Orthodoxy should be considered a minority religion in which case Sutherland Shire and Georges River i would expect that to be the main minority religion.
@Nimalan I’ll probably make it tomorrow.
All good Nether Portal
I’ve created the map. You can view it here: https://jmp.sh/3FTR5Uz8
It shows the main non-Christian religion by LGA and it’s shaded by how many people follow that religion. I’ve only included the metropolitan LGAs, i.e those in Greater Sydney and the Lower Hunter (Greater Newcastle-Maitland).
Key:
* Blue: Judaism
* Green: Islam
* Orange: Hinduism
* Yellow: Buddhism
There appears to be a trend where the LGAs with the lowest percentage of non-Christian religious people seem to have Buddhism or to a lesser extent Hinduism as the largest religion. Not sure why, perhaps it’s due to the Chinese and Indian communities being very large nationwide and even existing in the regions and remote areas but in saying that Chinese people are mostly irreligious (Chinese, Japanese and Koreans usually describe themselves as spiritual but not religious) and Indians are mostly Hindu.
Interestingly Newcastle, Shellharbour and Wollongong have Islam as the largest religion other than Christianity as does Camden. Camden makes sense since it’s near Campbelltown and is in Greater Western Sydney but the others aren’t.
We tend to think, Nether Portal, that the people come first then the temples etc come later, but I know there are a lot of cases in Sydney and Melbourne where the opposite is the case. The temple goes in first then the people follow to be near the temple. So maybe there is something that draws muslims into those LGA’s, whereas other religions are more dispersed throughout the greater metro areas?
Or the census figures (I assume this is where you got the data) are wrong.
@MLV they are Census figures and I can tell you they are correct.
It is true that Muslims are mostly concentrated in specific parts of Sydney and Melbourne. We can see on the map that Muslims are mostly concentrated in southwestern Sydney.
Nether Portal great map as always and thanks again for doing it. I think i agree with you point that Buddhism is often represented even if a few Chinese practice it it will show up as the most common minority religion. With respect to Japanese the community is small in Australia so i dont think it have an impact. Koreans have a large % of Christians as well. This is why Buddhism is the main minority religion in Northern Beaches even though they are clearly more Buddhists in Cumberland, Canterbury-Bankstown, Parramatta Liverpool than the Northern Beaches. Indians and other South Asians have a very % of people who are irreligious which is why Hinduism shows up in Kur-ring gai, Ryde Lane Cove while Liverpool, Cumberland would have way more Hindus. Georges River is interesting as it has a significant Nepalese community although that is concentrated in the Higher Density parts such as Kogarah, Hurtstville and many will be renters while the Nepalese community in Bardia would be home owning. If we take Eastern Orthodoxy as a minority religion then we a contagious range of neighbouring LGA starting from Randwick, Bayside, Georges River and the Shire where Eastern Orthodoxy is greater than any other non Christian Religion.
* very few % of people who are irreligious among South Asians.
@Nimalan I agree that the Japanese community is smaller than the Chinese and Korean communities but it’s not invisible. There are lots of Japanese restaurants around Australia and sushi is quite popular in Australia. Nevertheless, the Japanese community itself seems to be concentrated in parts of Queensland (the Gold Coast and Cairns have large Japanese communities).
It is also true that there are many Asian Christians in northern Sydney. There are many Chinese and Korean churches there.
And Eastern Orthodoxy does seem to be big in southeastern Sydney and Wollongong (Wollongong is home to a large Macedonian community and there is a soccer team down that was founded by Macedonians and used to be called Wollongong Macedonia), and Uniting Church seems to be big in Newcastle.
@ Nether Portal
Yeah good point about the Japanese community which is why perhaps Buddhism is the main minority religion in Leichardt and the Gold Coast seats. You are correct there is actually more Eastern Orthodox Christians in Wollongong and Shellharbour than Muslims so it the Orthodox Belt does not stop at the Royal National Park. Areas with the highest concentration of Buddhists tend to have large Vietnamese and other Indochinese such as Cambodians or Laotians.
It will be interesting if this map is done in another 10 years in that case i think areas like Penrith, Camden and the Western Part of Liverpool will have way more Hindus as all of these are growth areas that also attract South Asians.