
Tasmanian state elections often play out across a north-south divide, with the two southern electorates playing out differently than the northern remainder of the state.
In this post I thought I would try and map out some of these dynamics over the last 35 years and understand how they might impact on this upcoming election.
This blog post is borrowing a bit from a post I did after the 2021 election, which you can read here.
I’ve divided the state into two regions of north and south. In reality the dividing line between the north and south (possibly using the divide between where people drink Cascades and Boags) would run through the middle of Lyons, but generally the electorate of Lyons has a bit more in common with the less urban north, so I’ve grouped it in the north.
The south covers the electorates of Clark (formerly Denison) and Franklin. Clark is the only wholly urban electorate, but Franklin also covers a substantial part of the Hobart urban area, as well as rural areas to the south-west of Hobart. Overall these electorates are dominated by Hobart.
The north covers Bass (which mostly consists of voters in Launceston) but also covers the more rural north-west and central parts of the state.
This first chart shows how far the vote for the three main parties has deviated from their statewide vote at each election from 1989 until 2021 in the two regions.
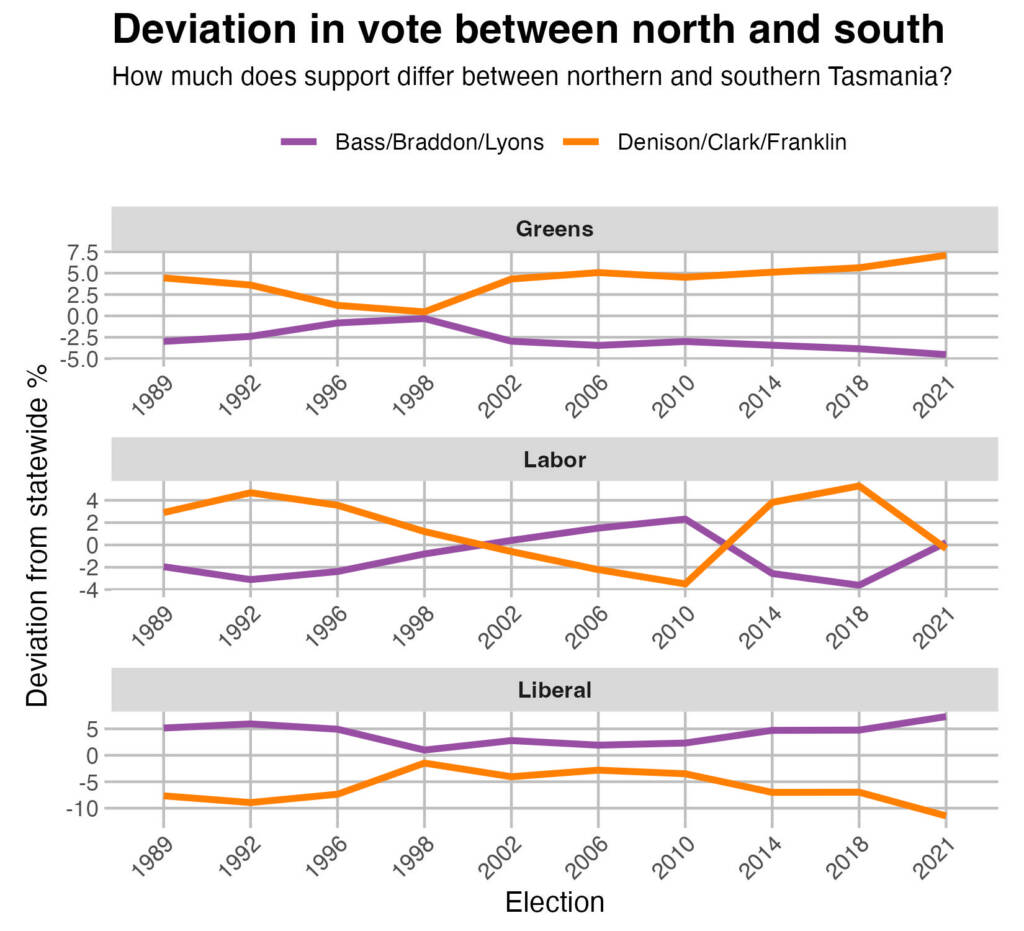
The Greens have always done better in the south, but in the 1990s they came close to parity. Since 2002 the gap has mostly been widening, to the point where the Greens polled 19.5% in the south and 7.9% in the north in 2021.
The Liberal Party has always done better in the north than the south, but again the gap a smallest in 1998, and has been generally growing, reaching a peak in 2021.
The Labor chart is the most interesting, as they have moved back and forth. Labor was generally stronger in the south from 1989 until 1998, when they won power. They were then stronger in the north in their years of majority government until 2010. Their strength in the north quickly evaporated in 2014 after four years in government with the Greens, and returned to relative strength in the south in 2014 and 2018, but the two areas reached parity in 2021.
I had gone back and forth about how best to present this information – do I analyse the actual raw primary votes (which shows the general up-and-down trends, but can make it harder to see the relative position) or just how much each region or electorate varied from the average? And do I look at all five electorates or just the regional totals. So I’m doing both. The next charts go in more depth on the three parties and give more of an insight into why these trends have happened. At the end I also have something about the Jacqui Lambie Network.
The Liberal Party has consistently performed worst in Franklin and Clark, although Franklin hasn’t been anywhere near as bad in recent elections. Bass and Braddon in recent years have been close to each other with the highest Liberal vote, although traditionally Braddon had been a bit more Liberal-leaning. Lyons has been closer to the state average. Lyons and Franklin got a bit tangled up when the Liberal Party was at a low point in the early 2000s.
The reason for the narrow gap in 1998 seems to be the surprisingly poor performance in Lyons, where the Liberal Party polled 3-4 points worse than in the southern electorates.
It’s worth noting that all five electorates moved further away from each other in 2021: the Liberals gained swings in the three northern seats and lost ground in the two southern seats.
What stands out for me in the Labor chart is how the northern electorates simply swing more.
Denison and Franklin were amongst Labor’s best electorates at elections which didn’t produce Labor majorities, such as 1989, 1992, 2014 and 2018.
Yet Braddon and Lyons were Labor’s best electorates during their strong years in government from 1998 until 2010. Braddon was either the worst or second worst electorate in 1989, 1992, 1996, 2014 and 2018.
The change in trends in 2021 can be chalked up to a single electorate: Clark. Labor’s vote was largely stable in the other four electorates, but in Clark it crashed, suffering a swing of almost 20%. Strong independents seem to be the main cause.
Denison and Franklin were the Greens’ best two electorates for most of the party’s history, but this was a bit less clear in 1996 and 1998. That may be related to the party being led by Christine Milne, who represented the central electorate of Lyons and had been known for political campaigns in the north of the state, and is the party’s own leader to not represent one of the two southern electorates. It roughly tied Franklin for Greens support during her leadership. Indeed Lyons generally polled around the state average for the party until 2010, but since 2014 it has been falling away.
The Greens polled almost the same vote in 1998 and 2018, but managed 8.1% in Braddon in 1998 and less than 4% in 2018. That may have actually worked better for the party in terms of winning seats at a low point, with the party winning one seat in 1998 and two in 2018, but is less helpful if the party is to gain support and win more seats in a bigger parliament.
Finally let’s discuss the Jacqui Lambie Network. The party has only run in one state election, in 2018, and only ran in the three northern electorates. They polled between 4.6% and 5.9% in those contests. But the party has contested three Senate elections across the state.
When you simplify the data to north vs south there is a clear northern bias. JLN polled around 9-12% in the northern half of the state, and just 5-6% in the south. Yet when you look at the five seats it looks more like three tiers of support.
The party is by far at its strongest in Braddon. Indeed Lambie polled over the new House of Assembly quota in 2016 and 2019, and fell just short in 2022. If the party polled that level at the state election, they would definitely win a seat.
Lyons and Bass (but more Lyons) come next. It makes sense considering that Bass is a more urban seat than Lyons. And then JLN is weakest in the Hobart-area seats.
Of course JLN has yet to prove itself in a Tasmanian state election. The candidate-centred electoral system makes it harder for a party whose most prominent member is not running. But if they have any underlying strength, it’s mostly in Braddon and to a lesser extent in Lyons and Bass.
Our Tasmanian state poll.
Lib – 33
Lab – 29
Greens – 14
JLN – 10
Other – 14In Bass, Braddon and Lyons
Lib – 35
Lab – 27
Greens – 11
JLN – 14
Other – 14In Clark and Franklin
Lib – 30
Labor – 31
Greens – 18
JLN – 4
Other – 17Sample size 753 https://t.co/g7VpceTTqC
— Kos Samaras (@KosSamaras) March 4, 2024
Indeed at least one poll from Tasmania has shown a north vs south breakdown which is interesting considering the context of this post. The major party vote tends to be similar in the two regions. Understandably Labor and Greens do better in the south and the Liberal Party does better in the north, but the gap is much smaller than the previous results would lead you to believe.
JLN however has an enormous gap between 4% in the south and 14% in the north. That could work in their favour. 10% may well be enough to win a seat in an electorate, but I suspect this poll is still overstating their support a bit. They can probably win more seats off a given state vote if their support is stronger in some electorates and bottoms out in others.

It’s essentially an urban-vs-rural divide isn’t it, Ben – what with Hobart dominating the 2 southern electorates, and Launceston only being a small fraction of the north?
Hmm I think if it was an urban-rural divide you’d expect Bass to align more with the south. Bass is mostly Launceston.
I say it’s more of an Inner Urban-Outer Urban-Rural Divide. Since even there is a divide between the inner-half and outer half of every major city and even some regional cities.
Voice referendum can be a evidence for this divide as I charted from The Red Rooster Line in Sydney and Ring Road (include the future NE Link) in Melbourne where I saw a sea of mostly Yes Voting booths on one side and a sea of mostly No votes booths on the other
Marh, I think Tasmania is different because Hobart is such a small city compared to the big two (Sydney and Melbourne) which have clear suburban divides.
Hobart is more of a North-South Divide than Inner-Outer one
Interestingly, Tasmanian state electorates often vote for the same party:
1992: Liberal landslide; the Liberals won a plurality of the vote in every seat
1996: the Liberals won the state election and a plurality of the vote in Bass and Braddon, but Labor won a plurality of the vote in Denison, Franklin and Lyons
1998: Labor landslide; Labor won a plurality of the vote in every seat except Bass
2002: Labor landslide; Labor won a plurality of the vote in every seat
2006: Labor landslide; same as 2002
2010: Labor formed a coalition government with the Greens but only won a plurality of the vote in two seats (Denison and Lyons), with the Liberals winning a plurality of the vote statewide and in three seats (Bass, Braddon and Franklin)
2014: Liberal landslide; the Liberals won a plurality of the vote in every seat
2018: the Liberals won a plurality of the vote in every seat except Denison
2021: the Liberals won a plurality of the vote in every seat
Note that Denison is the seat covering the inner-city suburbs of Hobart, and is now called Clark. The five Tasmanian state electoral divisions share the same boundaries and names as the five federal electoral divisions in Tasmania.
I think Marh is correct. The split really is the same as the urban/suburban split in the rest of our major cities, just probably more pronounced in TAS because of the geographical divide e.g. you can’t commute to Hobart from Launceston the way you can from Cranbourne to Melbourne.
Interestingly, within Franklin, there are small townships and villages south and west of the Derwent that are very progressive for their size. You wouldn’t find such a concentration of many small centres with high Labor or Greens primaries other than the Northern Rivers of NSW. They, along with Hobart, boost the overall non-Liberal vote in the south.
Launceston is like many other regional cities. There’s strong support for Labor and the Greens close to the CBD but the outer suburban areas as well as smaller and more remote communities, are staunchly Liberal. This produces a result in Bass that skews more towards Liberal.
In Braddon, and to a lesser extent in Bass and Lyons, JLN is more or less the third force whilst down south the Greens are the third force. Braddon looks to be the JLN’s best shot since JL’s hometown is here.
I think the small townships in Franklin are progressive communities like the Macedon Ranges, Dandenong Ranges, Northern Rivers and Blue Mountain
Comments are closed.