| Electorate | Margin | Electorate | Margin |
| Auckland Central | NAT 10.60% vs LAB | Mount Albert | LAB 24.10% vs NAT |
| Botany | NAT 37.81% vs LAB | Mount Roskill | LAB 10.59% vs NAT |
| East Coast Bays | NAT 52.49% vs LAB | New Lynn | LAB 22.58% vs NAT |
| Epsom | ACT 6.68% vs NAT | North Shore | NAT 41.87% vs LAB |
| Kelston | LAB 25.31% vs NAT | Northcote | NAT 29.00% vs LAB |
| Māngere | LAB 63.30% vs NAT | Pakuranga | NAT 44.06% vs LAB |
| Manukau East | LAB 63.03% vs NAT | Tāmaki | NAT 50.33% vs LAB |
| Manurewa | LAB 36.41% vs NAT | Te Atatū | LAB 8.27% vs NAT |
| Maungakiekie | NAT 5.74% vs LAB | Upper Harbour | NAT 30.01% vs LAB |
Local electorates
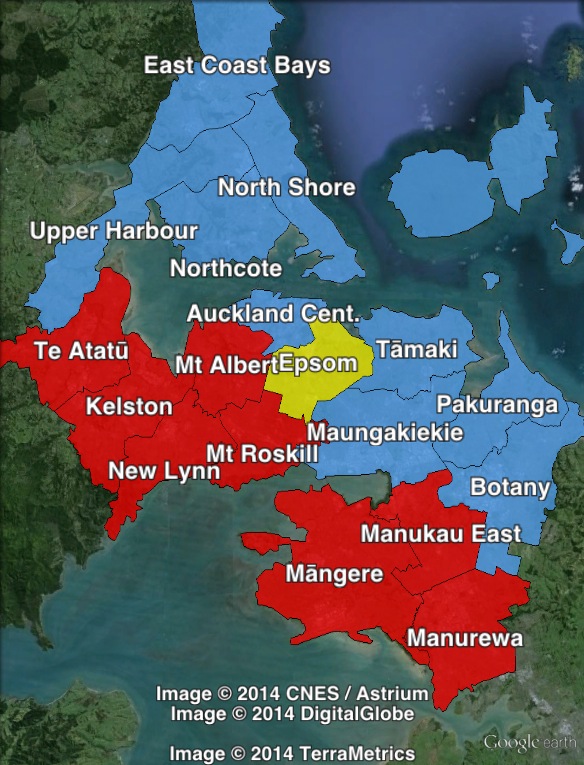
There are eighteen electorates in the Auckland urban area.
Nine seats are held by the National Party, eight seats are held by the Labour Party, and one seat is held by ACT.
Five of these could be considered to be marginal. Auckland Central is held by the National Party by 10.6%, and was Labour-held until 2008. Maungakiekie is held by the National Party by 5.7%, and likewise was Labour-held until 2008.
The Labour seats of Mount Roskill and Te Atatū are both seats held by relatively slim margins, but have Labour-dominated histories and should remain in Labour hands.
The ACT seat of Epsom is a unique electorate. The seat naturally tends towards the National Party, who held it until 2005 and who win a large majority of the party vote, but the seat has been won by ACT at the last three elections thanks to vote-splitting from National voters attempting to preserve a right-wing ally for the National Party. ACT has not come close to passing the 5% threshold since 2005, so relies on winning Epsom to remain in Parliament.
Auckland can be divided into a number of separate regions. The three south-eastern Labour electorates of Māngere, Manukau East and Manurewa are all extremely safe Labour seats.
In the east of Auckland, immediately north of the very strongly pro-Labour areas in the south-east, are three safe National seats: Botany, Pakuranga and Tāmaki.
Labour also holds the safe seats of Kelston and New Lynn in the western suburbs. Kelston is a newly-drawn electorate, and New Lynn has been significantly redrawn, being drawn into the urban area and losing its rural parts to Helensville.
In the northern suburbs, National holds four seats by very safe margins: East Coast Bays, Northcote, North Shore, Upper Harbour. Upper Harbour is a newly drawn electorate.
Most of the seats in central Auckland are more marginal, including the National seats of Auckland Central and Maungakiekie, the Labour seat of Mount Roskill, and the ACT seat of Epsom. The one other marginal electorate, Te Atatū, is in the outer west of Auckland.
Redistribution
Changes in central and eastern Auckland were relatively minor, but substantial changes were made in western Auckland.
The electorates of Helensville, New Lynn and Waitakere overlapped urban and rural parts of Auckland’s western fringe. In the results table below, these three electorates are counted as part of ‘Auckland Surrounds’ and thus are not included in the table.
In the redistribution, Waitakere was abolished, Helensville shifted into more rural areas and New Lynn shifted further into Auckland, and two new electorates (Kelston and Upper Harbour) were created in the area. This increased the number of seats in the Auckland urban area from 15 to 18 and cut the number of nearby seats by two.
Assessment
The Labour Party polls higher in the Auckland region than nationally, about 4% above the nationwide electorate vote, and 5% above the party vote. The National vote is about the same as the national average.
New Zealand First and the Green Party both polled less well in Auckland than in the country as a whole.
2011 election results
| Electorate Votes | Party Votes | |||||||
| Party | Votes | % | Swing | Redist | Votes | % | Swing | Redist |
| National | 213,527 | 46.04 | +2.39 | 46.37 | 230,001 | 47.78 | +0.57 | 47.54 |
| Labour | 180,660 | 38.96 | +2.58 | 39.25 | 155,452 | 32.29 | -1.91 | 32.45 |
| Green | 24,307 | 5.24 | -0.23 | 5.36 | 45,521 | 9.46 | +3.76 | 9.41 |
| New Zealand First | 7,347 | 1.58 | +0.67 | 1.37 | 24,107 | 5.01 | +2.07 | 5.12 |
| Conservative | 12,557 | 2.71 | +2.71 | 2.68 | 10,225 | 2.12 | +2.12 | 2.21 |
| ACT New Zealand | 21,784 | 4.70 | -3.35 | 4.12 | 6,727 | 1.40 | -3.39 | 1.35 |
| Māori | 2,830 | 0.59 | -0.08 | 0.57 | ||||
| Mana | 1,481 | 0.32 | +0.32 | 0.33 | 2,046 | 0.43 | +0.43 | 0.42 |
| Legalise Cannabis | 456 | 0.10 | +0.03 | 0.22 | 1,857 | 0.39 | +0.11 | 0.40 |
| United Future | 548 | 0.12 | -0.62 | 0.10 | 1,743 | 0.36 | -0.43 | 0.37 |
| Libertarianz | 213 | 0.05 | 0.00 | 0.05 | 347 | 0.07 | +0.02 | 0.07 |
| Democrats | 313 | 0.07 | +0.05 | 0.06 | ||||
| Alliance | 202 | 0.04 | +0 | 0.04 | ||||
| Others | 856 | 0.18 | -4.45 | 0.16 | 0 | 0.00 | -3.32 | 0.00 |
